By now, you’re probably rocking RipCharts in your fishing arsenal. But it’s more than just a pretty picture of the water currents and temperature breaks. RipCharts guru Chris Fullilove lets me in on some handy hacks used by the pros. As he says, “To get the most out of RipCharts, you should be interacting with the maps, zooming into areas, turning layers on and off, and customising the raw SST data.”
HOT & COLD
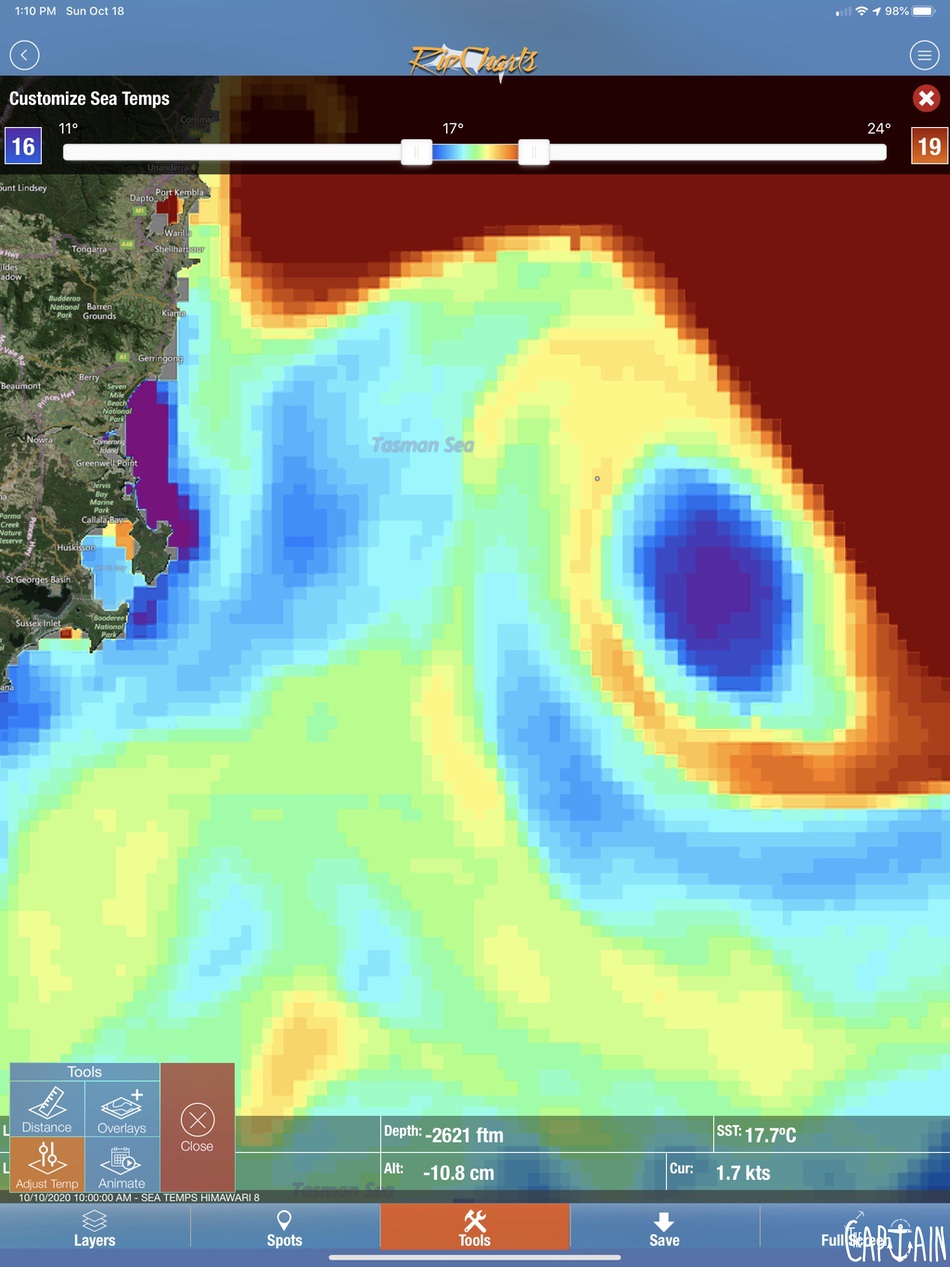
Chris says: “One of the most popular RipCharts analysis tools is the ability to customise and reprocess SST charts according to a constrained temperature range.” In my experience, all the good game-fishing crews are fine-tuning their temperature ranges to reveal the temperature breaks. We often find fish or bait on temperature breaks with a difference of one or two degrees Farenheit. “They may only deviate by a couple of degrees, but by reprocessing the SST image according to a tighter temperature scale, subtle filaments of water or secondary temperature zones are highlighted,” Chris reckons.
GET LAID
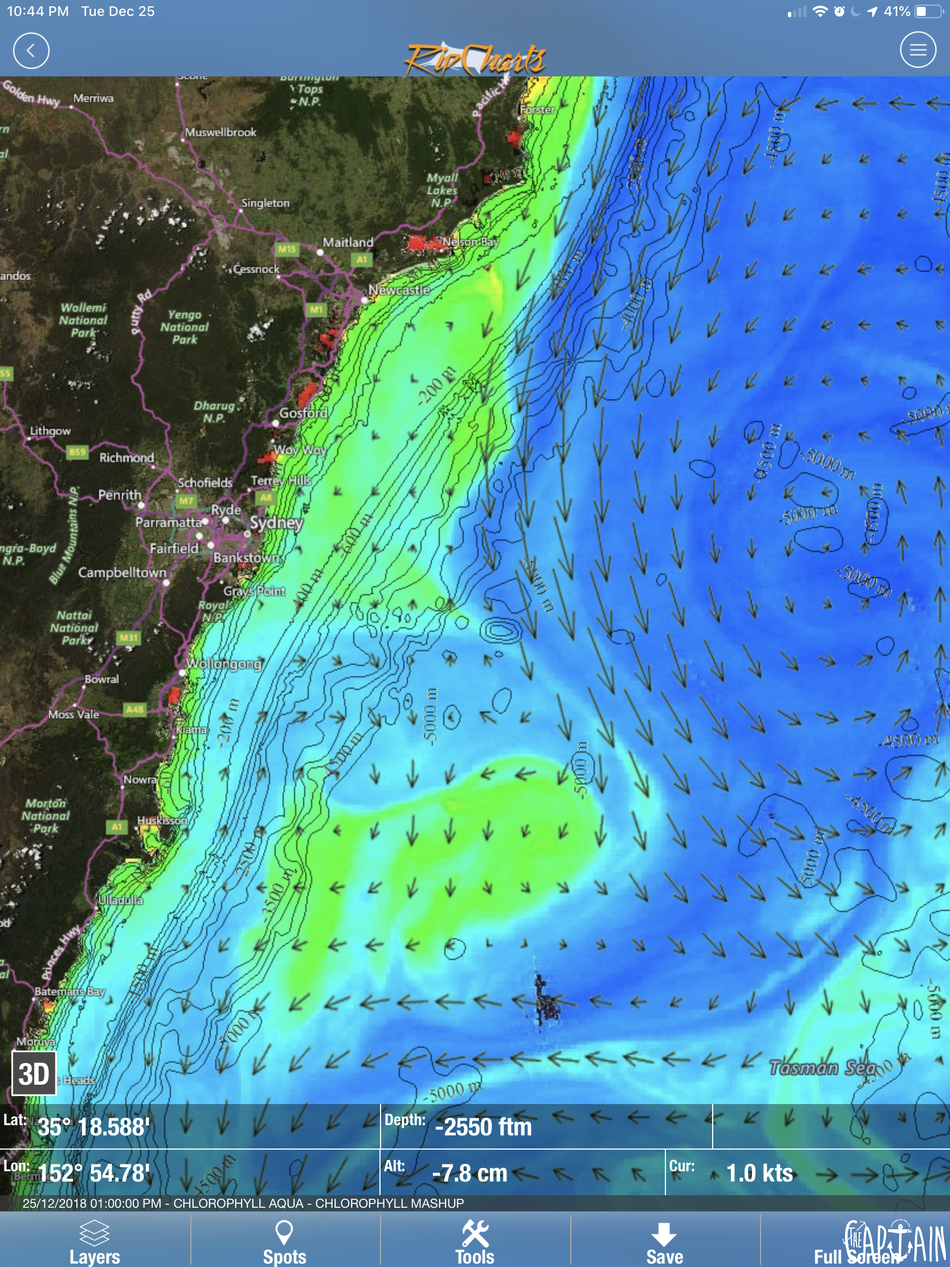
Baitfish and pelagics are found in a combination of water temperatures and colour, so combining layers of information is critical to the hunt. As Chris explains, “The mobile app has a new overlay tool that allows you to add an additional map layer on top of the base image. This can determine if warm water aligns with blue water. In this scenario, open an SST image first, and then, using the overlay tool, lay down a chlorophyll image. The overlay tool allows you to toggle the overlay layer on and off, which lets you evaluate the SST and chlorophyll together in order to find the best areas from both charts. Having awareness of both charts ahead of time will help you find and understand where the fish are.”
CHLOROPHYLL EXPLAINED
For non-fishermen, chlorophyll is what plants use to absorb energy from light. In RipCharts’ case, it’s used to detect water colour. As Chis explains, “Blue chlorophyll indicates blue water, green chlorophyll shows green water, and yellow/orange/ red chlorophyll points to dirty water. Pelagics can often be found on the colour change between green and blue water. Blue marlin are also primarily found in blue water.” Good tip. Cheers Chris.
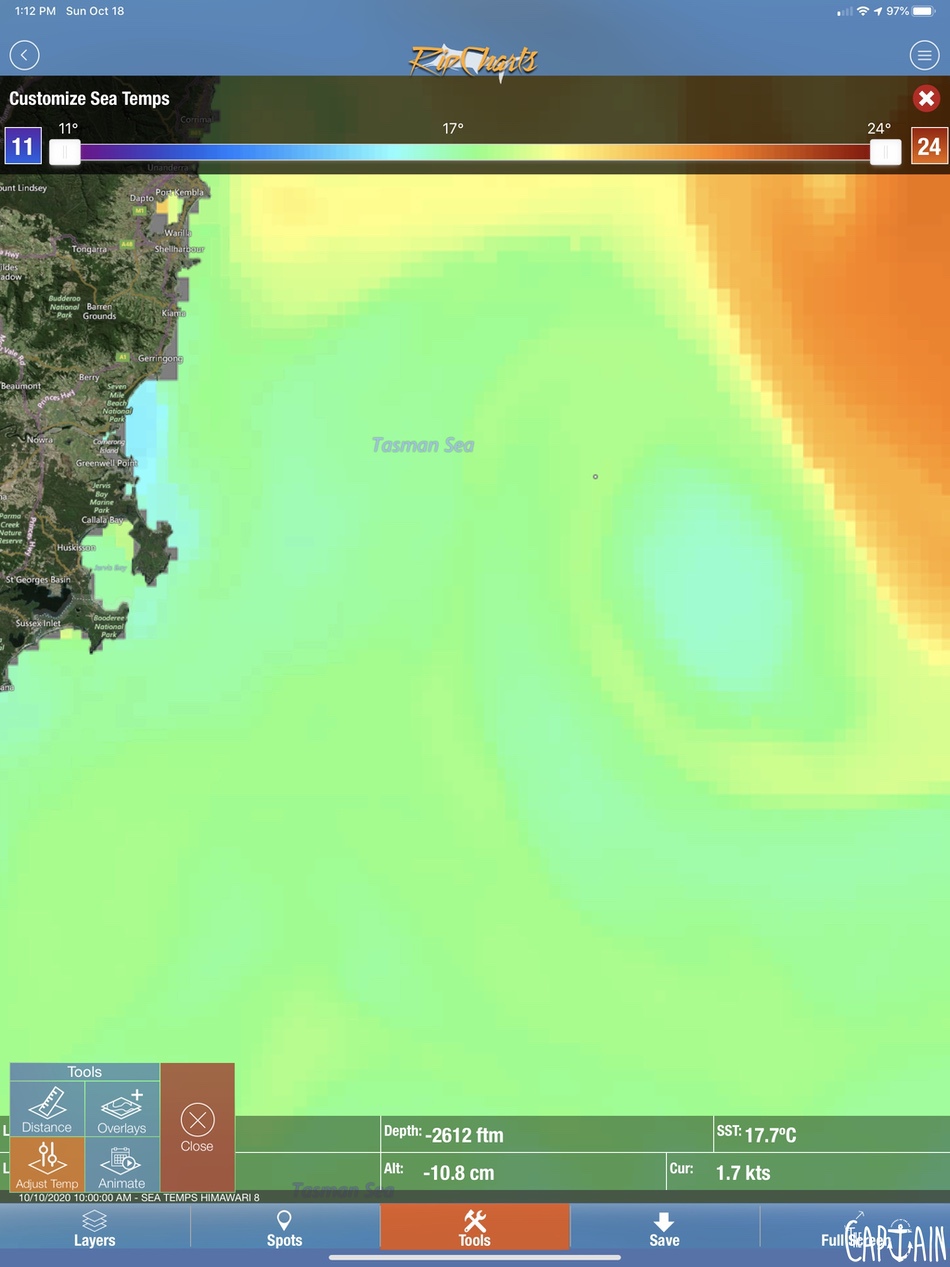
BATH TIME
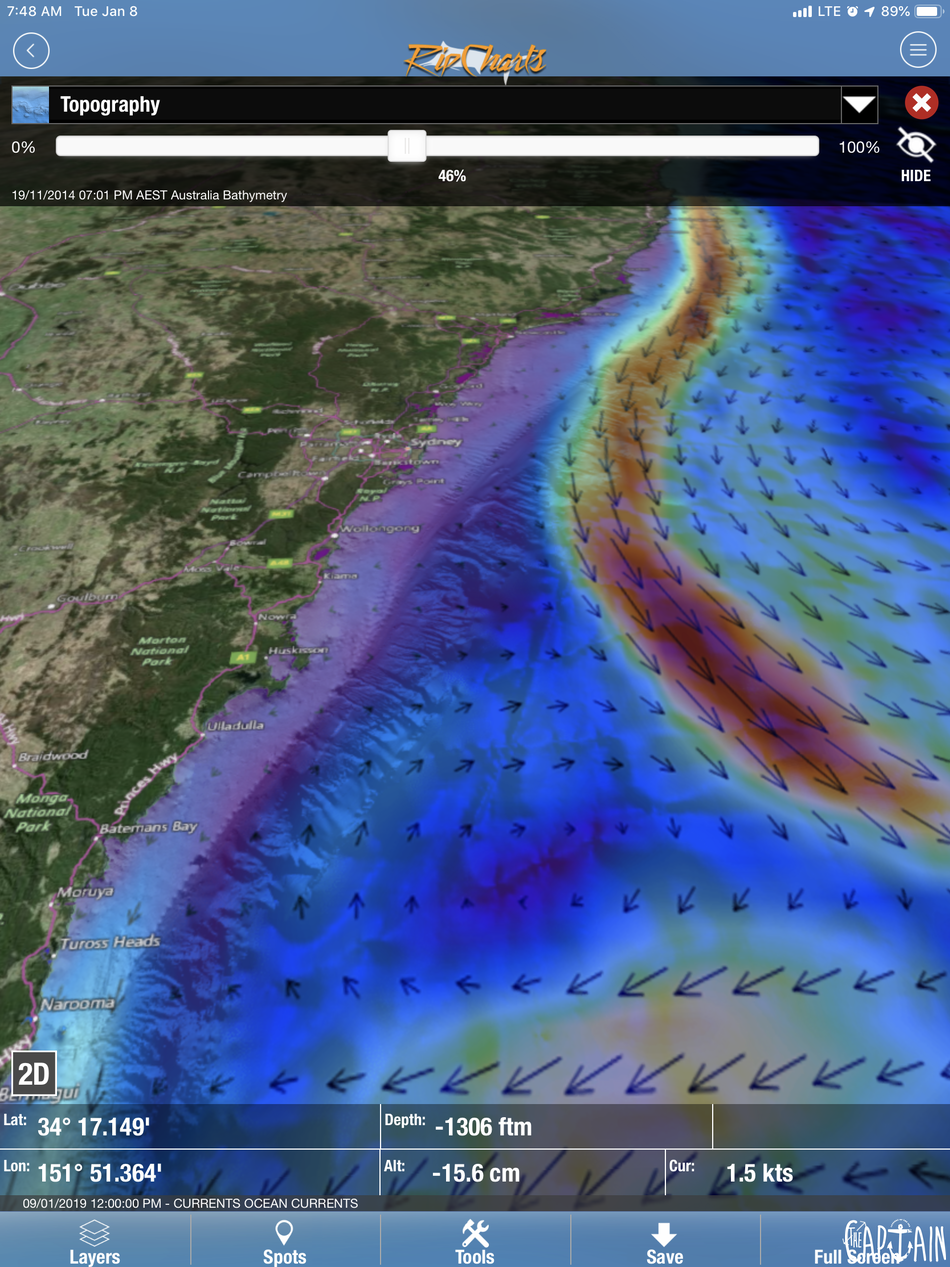
A popular overlay is the 3D shaded bathymetry chart. This clever bit of gear has an opacity slider. By adjusting it you can create the effect of looking through an image. “When used with the bathymetry chart, the overlay tool helps you understand if certain water is pushing over a canyon, shelf edge or some other bottom feature,” Chris says. In the screenshot image, a 3D shaded bathymetry chart has been used as an overlay. The bathymetry chart has been adjusted with an opacity of 46 per cent so you can see through the layer and observe the currents in conjunction with the sea floor.
TIME TRAVELLER
Another new feature introduced to the RipCharts app is the ability to animate maps across time and then forecast conditions. This hack is a game-changer for me, so I press Chris on the finer detail. “This tool will load a series of maps in a thumbnail strip,” he says. “You can load them up as if you’re watching a film strip. Over the time scale, you’ll see how water is changing, whether a plume of warm water is moving into the shelf or if a large upwelling is approaching or dissipating. When you compare three or four good shots over a period of time you’ll understand how the water is moving and be able to anticipate its future behaviour.” Somebody bring me my DeLorean!

MAPS TO GO
In other RipCharts news, the clever charts crew has included an offline mode. This allows you to download RipCharts imagery to your phone/tablet. Using the GPS chip on your device, you can then navigate offshore — even when out of cell tower range — with the satellite imagery you previously downloaded.
If you like the cut of RipCharts’ jib, check out the mobile app — available from the App Store or at www.ripcharts.com
Recent Comments